Effectiveness of Selection: Initial Gene Frequency and Fitness Differences
The aim of selection is to increase the frequency of desired alleles and decrease the frequency of undesired genes in a population, ideally producing animals that breed true for the genotypes and phenotypes selected for.
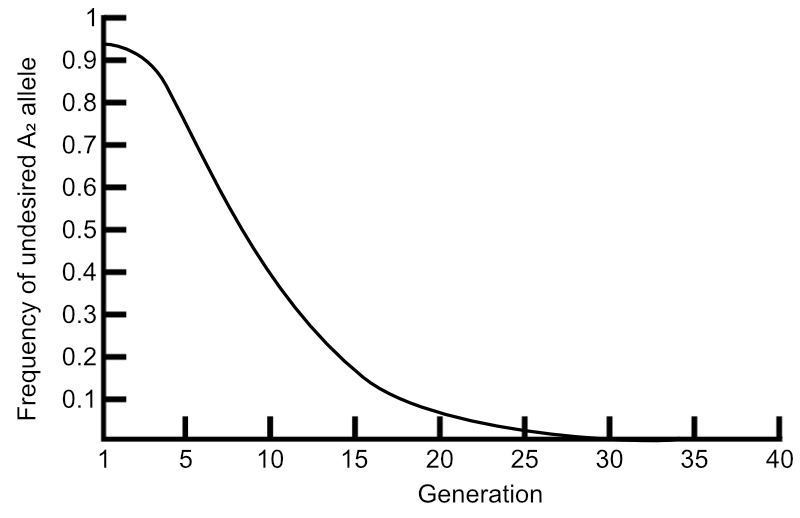
One influence on the effectiveness of selection on gene frequency changes is the initial gene frequency in a population. Consider two alleles at locus A: A1 is wanted and A2 is not. This graph plots the frequency of A2 in each successive generation, showing the effect of selection against that unwanted allele A2 over many generations:
The steeper the slope of the line, the faster the change in the frequency of A2 from one generation to the next, and the quicker it is removed from the population.
In the above graph, A2 exists at a very high frequency at the beginning of the selection programme — it occupies over 90% of the A locus in the entire population. It is a slow process to remove this allele at first, as so many animals carry it. This is shown by the slow-to-get going slope of the line from generations 1 through 5.
Once A2 does drop in frequency, A1 by default increases in frequency, and as more and more animals inherit A1, selection against A2 accelerates as more and more A1 alleles in the population become available to select for.
Another influence on the effectiveness of selection on gene frequencies is the fitness of individuals within a population. ‘Fitness’ is the ability of an animal to have offspring. The fittest animals are those that are not only selected for their genotypes and phenotypes, but which also produce the most offspring with those genotypes and phenotypes.
Consider the following graph:

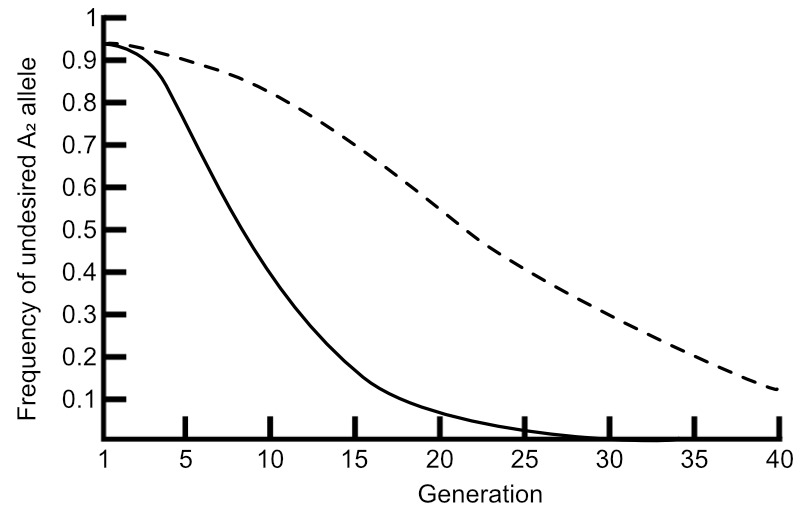
Solid line: large fitness differences. Broken line: small fitness differences
© Optimate Group Pty Ltd
This is the same graph as above, but with an extra line. Here, the solid line represents large differences in fitness amongst the genotypes of the breeding population. The broken line represents small differences in fitness amongst the genotypes of the breeding population.
For the solid line, if A1A1 genotypes are the fittest relatively, A1A2 genotypes may produce only three-quarters as many offspring in comparison, and A2A2 genotypes may produce only half as many offspring as A1A1 again. The differences in fitness are large.
For the broken line, if A1A1 genotypes are again the fittest relatively, A1A2 genotypes may produce almost as many — seven-eights perhaps — while A2A2 genotypes may produce three-quarters as many offspring as A1A1 animals. The differences in fitness are small.
Changes in gene frequencies are fastest when the differences in fitness are largest. This is because the most fit animals — the A1A1 genotypes in this example — produce the most offspring that in turn are selected to produce the next generation of offspring. The more A1A1 genotypes in each generation, the higher the frequency of the A1 allele at the A locus amongst the next generation.
Consider the extreme case of a lethal allele. Here the fitness difference is very large — homozygous and heterozygous animals with either no or just one copy of the allele survive and reproduce, while homozygous recessive animals with two copies die. Natural selection against that allele is very effective, in that the allele will exist at a very low frequency in the population, and homozygous recessive animals will be rare occurrences.
Compare that example with a gene responsible for smaller fitness differences — one that has a very small effect on the ability to conceive for example. Even the negatively-affected animals will still grow and reproduce at almost the level of fitness as the unaffected ones. There is very little difference in fitness between the genotypes and the allele will continue in the population with little influence from natural selection on its frequency. It is harder to effect change when there are only small differences in fitness amongst the genotypes.
Next week will cover the third influence on selection and gene frequency change: the degree of dominance with respect to fitness.

Leave a comment