Effectiveness of Selection: The Degree of Dominance With Respect to Fitness
Last week covered two influences on the effectiveness of selection on changing gene frequencies: the initial gene frequency, and fitness differences.
This week we go over a third influence: the degree of dominance with respect to fitness.
Think of ‘fitness’ as a trait like any other. Complete dominance of ‘fitness’ at a locus has both homozygous and heterozygous dominant animals equally fit, and each would be expected to produce the same numbers of offspring on average.
Should there be no dominance of ‘fitness’ at a locus, homozygous dominants would produce the most number of offpsring, homozygous recessives the least, and heterozygous dominants a number exactly halfway between these two.
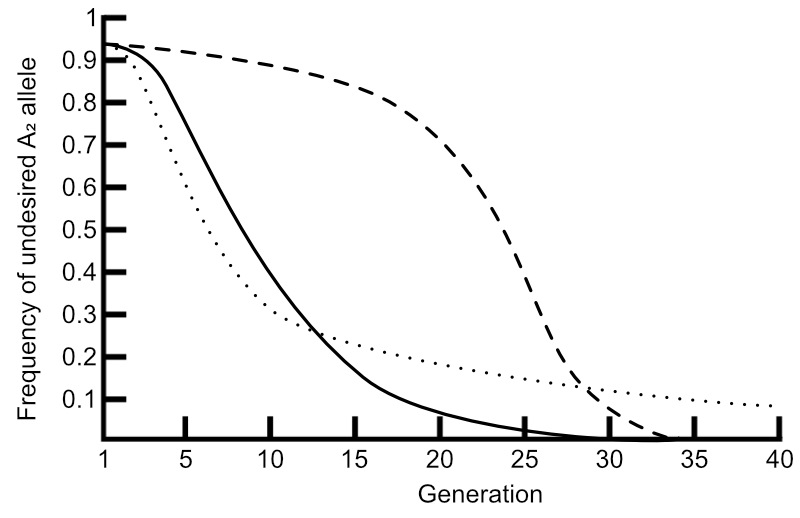
Consider the following graph:

Solid line: no dominance. Broken line: complete dominance. Dotted line: complete recessiveness.
© Optimate Group Pty Ltd
Here are represented the changes in frequency of an undesired A2 allele with respect to three degrees of dominance: no dominance (solid line), complete dominance (broken line), and complete recessiveness.
The solid line is the same as in the graphs here. With no dominance, gene frequency changes are fastest through the intermediate frequencies, and A2 can be completely removed from the population with time.
Selection against completely dominant alleles at very high frequencies, however, shows a very slow rate of change at the beginning, but does pick up and those alleles too can be removed from the population.
Selection against completely recessive alleles is markedly different to the first two scenarios. While the change in gene frequencies begins rapidly, this slows until the allele continues to persist at some lower frequency and is never removed completely.
This persistence is because completely recessive alleles have completely dominant counterparts — the dominant allele in a heterozygous animal is the one expressed, thus completely masking any recessive allele that may be present. This is compounded by the fact that recessive alleles are ’spread out’ thinly amongst a population when at very low frequencies. These two factors make completely recessive alleles extremely difficult to detect and select against.
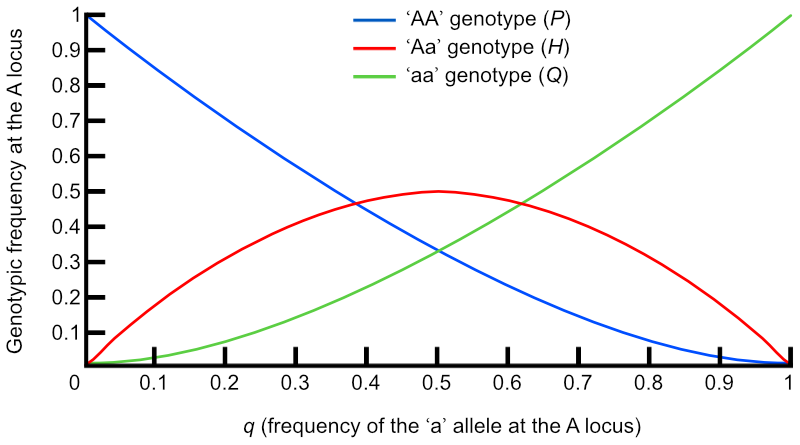
Let’s look again at this graph from The Effect of Selection on Gene and Genotypic Frequencies:
q, the frequency of the recessive allele ‘a’ is very low on the left hand side of the graph, and there are very few homozygous recessive genotypes compared to heterozygous ones. At these low gene frequencies, the completely recessive ‘a’ allele is more likely to be ‘hidden’ in these heterozygous animals than be visible in any homozygous recessive ones, simply because there are more heterozygotes in the population.
For example, assume the recessive allele ‘a’ has a frequency of 0.1 (10%), and that there are 100 animals in a herd, none of which is homozygous recessive. This means of the 200 ‘A’ loci in that herd, 20 carry the ‘a’ allele and 180 carry the ‘A’ allele. As no animal is homozygous recessive, this means twenty animals must be the heterozygous ‘Aa’ genotype. There is no way to detect which twenty are carriers unless they are mated to another carrier, or there is a genetic test for the ‘a’ allele, and the ‘a’ allele will likely be passed on undetected for many generations.
This elusiveness of completely recessive alleles is why to this day coloured spots still appear from time to time in elite merino sheep despite many decades of culling and selective breeding. Many other examples apply to other breeds and species. The allele could simply be ‘undesirable’, such as attempting to eliminate red coat from black Angus cattle, or very much unwanted, such as genetic defects that are lethal when homozygous recessive.
Next week, some calculations of changes in gene and genotypic frequencies caused by selection!

Leave a comment