The Effect of Mating Systems on Gene and Genotypic Frequencies: Outbreeding
Inbreeding is the mating of related animals with the effect of increasing homozygosity.
Outbreeding (also called crossbreeding) is the opposite of inbreeding, in that unrelated animals are mated with the effect of increasing heterozygosity.
Let’s step through an example by starting with two unrelated populations, 1 and 2.
Population 1 has gene frequencies at the A locus of p1 = 0.8 and q1 = 0.2.
Population 2 has gene frequencies at the A locus of p2 = 0.1 and q2 = 0.9.
Right away we can tell the two are unrelated as the gene frequencies differ so much.
Now cross them to create an F1 generation. (Back in Explaining Mendel’s Results Visually we defined an F1 generation as one resulting from the crossing of two purebred populations. Here we are using it more broadly to include two unrelated, but not necessarily purebred, populations.)

© Optimate Group Pty Ltd
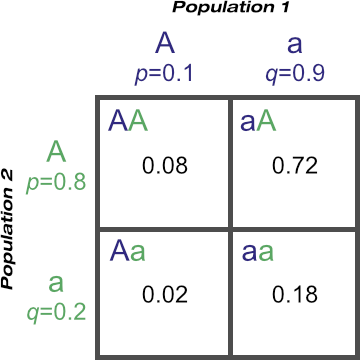
Where do the numbers come from? The gene frequency of ‘A’ in population 1 is 0.1, and in population 2, 0.8. Thus the probability of the ‘AA’ genotype occurring is the probability of inheriting the ‘A’ allele from population 1 and the probability of inheriting the ‘A’ allele from population 2.
In statistics, where we’d say ‘and’, we’d write ‘×’.
Therefore the probability of the ‘AA’ genotype arising is 0.1 × 0.8 = 0.08.
Likewise the probability of the ‘aa’ genotype can be calculated as 0.9 × 0.2 = 0.18.
However, the ‘Aa’ genotype could come from the ‘Aa’ combination or the ‘aA’ combination. They’re the exact same genotype, but can be formed in either of two ways depending on which populations contribute the ‘A’ and the ‘a’ alleles.
In statistics, where we’d say ‘or’, we’d write ‘+’.
Therefore the probability of the ‘Aa’ genotype is 0.72 + 0.02 = 0.74.
From the Punnett square results, the genotypic frequencies are:
PF1 = 0.08
HF1 = 0.74
QF1 = 0.18
(Note how these add up to 1.)
We can actually determine gene frequencies from genotypic frequencies. Let’s assume an F1 population of 100 animals. Statistically, 8%, or eight, are likely to be ‘AA’ genotype. 74% are likely to be ‘Aa’ genotype, and 18% of ‘aa’ genotype.
One hundred animals between them have 200 alleles at the A locus. Of these, eight will have two copies of the ‘A’ allele each, and 74 will have one copy each.
Therefore at the A locus there will be (8 × 2) + 74 = 90 individual ‘A’ alleles amongst the population, with a frequency of p = 90 ÷ 200 = 0.45.
As p + q must always add to one, the frequency of the ‘a’ allele, q, is therefore 1 - 0.45 = 0.55. But let’s work it out anyway:
At the A locus there will be (18 × 2) + 74 = 110 individual ‘a’ alleles amongst the population, with a frequency of p = 110 ÷ 200 = 0.55.
pF1 = 0.45
qF1 = 0.55
From these calculations can you see the formulae for working gene frequencies from genotypic frequencies?
p = P + ½H
q = Q + ½H
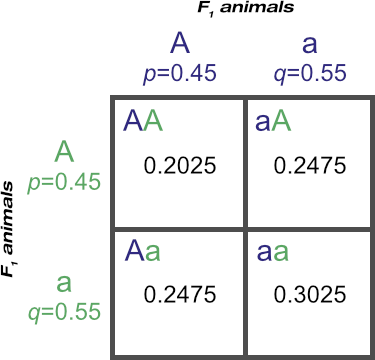
Now let’s cross the F1 population with themselves to produce an F2 population:

© Optimate Group Pty Ltd
You may be wondering why, if we are crossing an F1 population with ‘AA’, Aa’ and ‘aa’ genotypes, that this square shows only ‘A’ and ‘a’ combinations and not ‘A’ and ‘A’ and ‘a’ and ‘a’ combinations.
Please don’t confuse the squares here for the ones used back in Explaining Mendel’s Results Visually. There, we were determining the genotypes possible from the alleles carried by the parents. Here, we are determining the frequencies of genotypes possible in a population, based on the frequencies of the alleles in that population.
Thus we have F2 genotypic frequencies of:
PF2 = 0.2025
HF2 = 0.4950 (from 0.2475 + 0.2475)
QF2 = 0.3025
and F2 gene frequencies of:
pF2 = PF2 + ½HF2 = 0.2025 + ½(0.4950) = 0.45
qF2 = 1 - PF2 = 1 - 0.45 = 0.55
Interestingly, the gene frequencies have not changed between the F1 and F2 generations:
p, the frequency of the ‘A’ allele, remains at 0.45
q, the frequency of the ‘a’ allele, remains at 0.55
If gene frequencies stay constant between generations, and if the genotypic frequencies in the offspring generation are a result of the gene frequencies in the parent generation, it follows that mating an F2 population amongst itself would produce an F3 generation with the same genotypic frequencies as the F2 one.
Or, if matings within a population are completely random, then gene and genotypic frequencies do not change from generation to generation.
This concept is known as the Hardy-Weinberg equilbrium (named after the two men who independently discovered it), which we’ll cover in the next post!
Leave a comment