Explaining Mendel's Results Visually
This post will step through in greater detail all of Mendels results mentioned briefly in the It All Began With Gregor Mendel post.
To recap, we know that he first established the following pure lines of garden pea:
Seed shape:
purebred round and purebred wrinkled
Seed colour:
purebred yellow and purebred green
Seed coat colour:
purebred coloured and purebred white
Pod shape:
purebred inflated and purebred constricted
Pod colour:
purebred green and purebred yellow
Flower position:
purebred axial (along the stem) and purebred terminal (at end of stem)
Stem length:
purebred long and purebred short
He then crossed each line, eg purebred yellow seed with purebred green seed, purebred coloured seed coat with purebred white seed coat, etc.
When two organisms that are pure-breeding for a character are crossed, the parental generation is called the ‘P’ generation. The progeny from this cross is called the first filial generation, from the Latin word filius, a son. ‘F1’ is the shorthand way of referring to the first filial generation. Crossing an F1 generation with itself produces an ‘F2’ generation (second filial generation). Crossing F2 with itself produces an ‘F3’ generation (third filial generation), and so on.
His results for this, first, parental cross were:
| Parental Cross |
F1 Outcome |
| round × wrinkled seeds | all round |
| yellow × green seeds | all yellow |
| coloured × white seed coats | all coloured |
| inflated × constricted pods | all inflated |
| green × yellow pods | all green |
| axial × terminal flowers | all axial |
| long × short stems | all long |
Instead of the F1 generation showing “blends” of the parents’ characters, every one of the progeny exhibited in full exactly one of the two characters that had been crossed. Mendel called these dominant, and this is the word we still use today. From the F1 Outcome column in the table above, Mendel found that round seeds are dominant over wrinkled seeds, yellow seeds are dominant over green seeds, and so on.
He termed the characters that did not appear as recessive. Wrinkled seeds, green seeds, etc, all receded from the F1 generation.
Mendel next crossed the F1 round seed types with themselves, the F1 yellow seed types with themselves, etc, and recorded the resulting F2 results:
| F1 Cross |
F2 Outcome | F2 Ratios |
| all round seeds × all round seeds | 5,474 round seeds 1,850 wrinkled seeds |
2.96 : 1 |
| all yellow seeds × all yellow seeds | 6,022 yellow seeds 2,001 green seeds |
3.01 : 1 |
| all coloured seed coats × all coloured seed coats | 705 coloured seed coats 224 white seed coats |
3.15 : 1 |
| all inflated pods × all inflated pods | 882 inflated pods 299 constricted pods |
2.95 : 1 |
| all green pods × all green pods | 428 green pods 152 yellow pods |
2.82 : 1 |
| all axial flowers × all axial flowers | 651 axial flowers 207 terminal flowers |
3.14 : 1 |
| all long stems × all long stems | 787 long stems 277 short stems |
2.84 : 1 |
Note how the results are roughly 3 to 1 ratios of dominant character to recessive character. This was the crucial discovery behind Mendel’s insight that these characters (‘factors’ as he called them, or genes as they became known) are units of heredity rather than a blend. He explained his discovery mathematically in his 1866 paper, but in 1905 British geneticist Reginald Punnett introduced his Punnett square as a teaching aid that explained breeding outcomes more simply.
The Punnett square is extremely effective at visually describing or predicting the results of Mendelian inheritance. Let’s introduce some terminology here before delving into how a Punnett square works.
Each characteristic (or trait) Mendel studied had two characters (or phenotype), eg the seed shape trait had two phenotypes: round and wrinkled; and the seed colour trait had two phenotypes, yellow and green. Round phenotype was found to be dominant to wrinkled phenotype, and yellow phenotype was found to be dominant to green.
In genetics the dominant phenotype is represented by an uppercase version of (usually) the first letter of the word that describes that dominant phenotype. For pea seed shape, round is the dominant character and so we denote this as ‘R’. Wrinkled phenotype is recessive, which we write as ‘r’, the lowercase form. Note we always use the same letter for the recessive phenotype as for the dominant phenotype, regardless of what word describes the recessive phenotype. If the dominant round pea shape is ‘R’, the corresponding wrinkled shape is always ‘r’, never ‘w’ for wrinkled, or any other letter. This shows at a glance which genes belong together. In Mendelian inheritance there is always a dominant gene and a recessive gene for each genotype: that is in fact the definition of Mendelian inheritance.
One last thing before getting back to the Punnett square — how those genes actually end up in the progeny.
I appreciate that most readers will already have the understanding that each parent carries two genes for each trait, and that the progeny inherits one of those genes from each of its parents to end up with two genes itself. Of those two genes at least one will be dominant and forms the phenotype seen in the progeny. (Please note that this is Mendelian inheritance — there are other patterns of inheritance that don’t follow these rules, which we will cover later.)
But most people don’t fully grasp the details of how only one gene per parent is passed onto progeny. I will cover these in a series of posts later, but for now this basic knowledge — that one parent contributes one gene and the other parent contributes a second gene for the same trait — will be more than enough to understand a Punnett square, so let’s move straight on.
Mendel began his experiments with pure-breeding lines, so let’s take the purebred round and the purebred wrinkled seed shapes as our example. As they are purebred, a round seed phenotype plant can only contribute ‘round’ genes and a wrinkled seed phenotype plant can only contribute ‘wrinkled’ genes. Because each plant has two genes for the ‘seed shape’ trait, we denote the purebred round seed genotype as ‘RR’ and the purebred wrinkled seed genotype as ‘rr’.
A Punnett square is simply a grid with one parent’s genes (genotype) across one side and the other parent’s genes (genotype) down the other. The inside squares represent all possible pairings that could arise when the two are crossed.
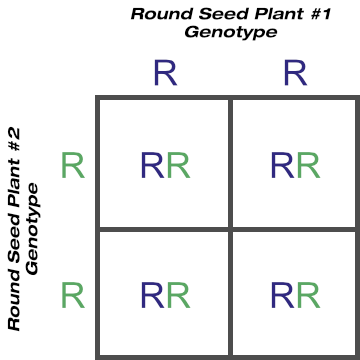
We can represent Mendel’s breeding of the purebred round seed plants he established his lines with like so:
© Optimate Group Pty Ltd
You can see at a glance how all progeny can only ever inherit an ‘R’ gene from each parent, becoming pure ‘RR’ in turn and maintaining the pure round seed line.
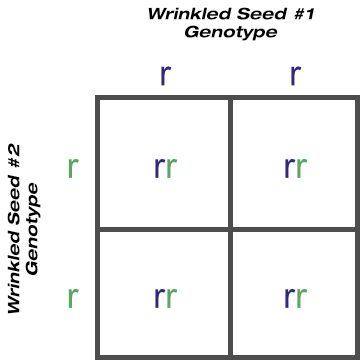
Similarly, the breeding of the purebred wrinkled seed plants to maintain that line can be shown like this:
© Optimate Group Pty Ltd
Again you can see how all progeny can only ever inherit an ‘r’ gene from each parent, becoming pure ‘rr’ in turn and likewise maintaining a pure wrinkled seed line.
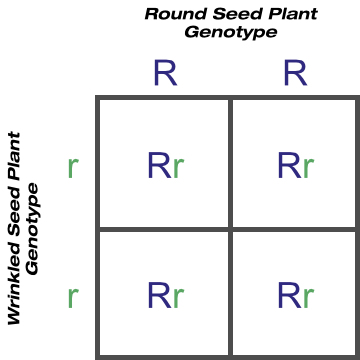
Things become far more interesting once different lines are crossed. With a Punnett square we can actually predict the outcome of crossing a purebred round seed shape with a purebred wrinkled seed shape, as we know each parent’s genotype:
© Optimate Group Pty Ltd
It’s very clear that every single outcome of this cross will produce progeny with an identical ‘Rr’ genotype. ‘R’ is the dominant gene and represents the round shaped seed phenotype. All progeny from such crosses — though they carry the recessive ‘r’ gene for wrinkled seed — will always have a round seed phenotype, exactly as Mendel observed. It’s also easy to see — and understand — why the recessive ‘r’ phenotype appears to have disappeared from the progeny. It didn’t disappear — it’s there but hidden.
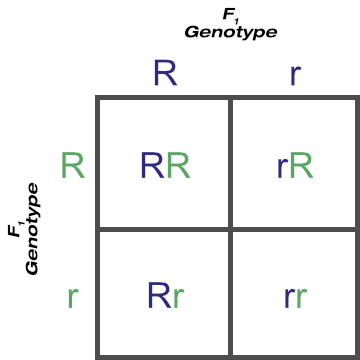
Mendel then crossed these F1 progeny. Again with a Punnett square we can predict the outcome he did in fact observe:
© Optimate Group Pty Ltd
This F2 generation comprises of one ‘RR’ genotype, two ‘Rr’ genotypes and one ‘rr’ genotype. (‘Rr’ and ‘rR’ in the square are the same genotype and it is more correct to write both as ‘Rr’.) We know ‘R’ (round seed) is dominant to ‘r’ (wrinkled seed), and thus from the above square we can see that crossing the F1 generation results, statistically, in three dominant phenotypes for every one recessive phenotype. The three to one ratio Mendel’s own results resembled.
I say statistically because this is the mathematically determined, not absolutely guaranteed outcome. Mendel’s own observed ratios, after many many matings, never attained a perfect 3:1. They did come very close though, ranging from 2.82:1 to 3.14:1, helped by his large sample sizes.
(We see such things all the time — statistically there is a 50% chance a baby will be a boy or a girl, yet we all know of large families with all girls or all boys, though we’d expect equal numbers of both.)
The above Punnett square also explains how recessive genotypes reappear after skipping a generation (or more in some cases). it is only in an F1 cross that a recessive gene can pair with its recessive partner to form the recessive phenotype. Even so there is only a one in four chance of this occurring.
Another point I wish to make concerns the one ‘RR’ and two ‘Rr’ genotypes. All three express the dominant phenotype, but only the ‘RR’ genotype is ‘pure’. This genotype is called homozygous, while the ‘Rr’ genotype is heterozygous. We’ll discuss the significance of these in later posts.
Mendel went further still and crossed the F2 generations with each other. The possible crossings were:
RR with RR
RR with Rr
RR with rr
Rr with Rr
Rr with rr
rr with rr
By now you can probably picture these as Punnett squares and do them in your head! You can see how the first three crossings in the list will always produce all ‘R’ phenotypes, the next two will produce both ‘R’ and ‘r’ phenotypes, whilst the last one will always produce all ‘r’ phenotypes. Mendel had observed from his first crossings the existence of dominant and recessive phenotypes, but it took these third crossings to show the one thing that hadn’t been observable until then — that recessive phenotypes when crossed will only produce recessive phenotypes in the offspring. A dominant phenotype will never appear when recessive ones are crossed. This was a significant finding that will be covered in more detail later.
One last note: Mendel did cross plants with the purpose of studying two traits simultaneously, and I’ll summarise one example here to show how a Punnett square can be used for those more complicated situations.
Consider a pea plant with round, yellow seeds. As ‘round’ and ’yellow’ are both dominant phenotypes we shall label them ‘R’ and Y’ respectively. Now further consider that this plant is heterozygous for both traits. This means it also contains the ‘r’ gene for wrinkled seed and the ‘y’ gene for green seed. Its genotype can be written RrYy.
Cross this RrYy plant with another RrYy plant in a Punnett square to predict the results. Remember that a parent only contributes one of R and r, and one of Y and y, so make your gene combinations accordingly:
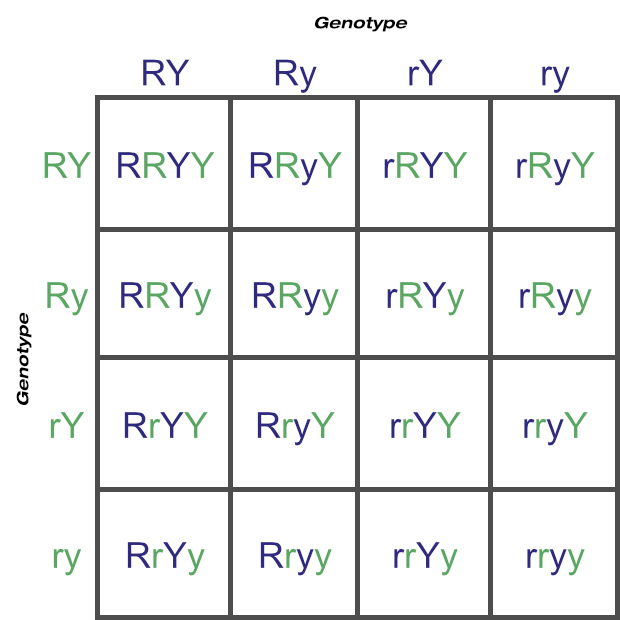
© Optimate Group Pty Ltd
Hopefully you now have a good understanding of Mendelian inheritance, and can predict accurately any crossings of traits that consist of a clear dominant and clear recessive phenotypes.
The next post will wrap up this mini series on Mendel with a discussion of the three Laws he devised, and lead into a discussion into what it is at the cellular level that results in an organism inheriting a particular set of genes as opposed to some other set of genes.
Leave a comment