The Effect of Selection on Gene and Genotypic Frequencies
Selecting animals for breeding is a process by which those deemed ‘best’ are allowed to be parents, and those deemed not, aren’t. The next generation is similarly assessed, and the next, and the next, with the population expected to improve incrementally each time.
This gradual improvement over time is due to the frequency of desirable genes increasing in the population and the frequency of undesirable genes decreasing in the population. This results in a group of animals with increased breeding value, as they have a higher concentration of ‘best’ genes more likely to be passed onto the next generation. That next generation, with its higher concentration of ‘best’ genes will perform* at a higher level than earlier generations did.
(* ‘Performance’ here is a breeding term that doesn’t necessarily refer to athletic performance such as speed. Rather, it refers to the resulting phenotype, as determined by the genotype. ‘Performance’ could be how fine a sheep’s wool is, for example.)
Gene frequencies, breeding values and performance are all intertwined. Increasing breeding values and performance in a population increases the frequencies of desirable genes. Increasing the frequencies of desirable genes increases breeding values and performance.
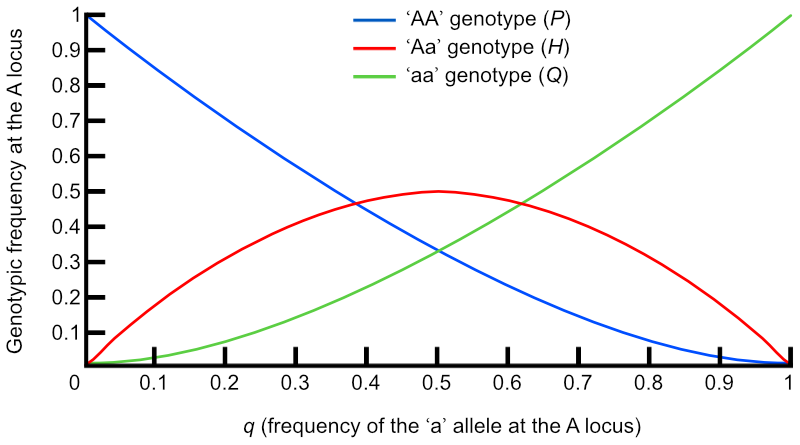
The following graph shows the interrelations between gene and genotypic frequencies at the A locus for the ‘A’ and ‘a’ alleles and ‘AA’, ‘Aa’ and ‘aa’ genotypes.
The x-axis value is q, the frequency of the ‘a’ allele. The y-axis value is the genotypic frequency of each of the genotypes P (the ‘AA’ genotype), H (the ‘Aa’ genotype) and Q (the ‘aa’ genotype). Please refer to Gene and Genotypic Frequencies for a brush-up on these terms if needed.
As the frequency of ‘a’ (q, the green line) increases and approaches 1, the frequency of ‘A’ (p, the blue line) simultaneously decreases and approaches 0, as p + q = 1.
The higher the frequency of ‘a’, the lower the frequency of ‘A’. With more and more ‘a’ alleles and less and less ‘A’ alleles in the population as a result, it follows that the ‘aa’ genotype (Q) increases as the ‘Aa’ genotype (H) decreases and the ‘AA’ genotype (P) decreases even more.
If the ‘A’ allele is favourable and selected for, its frequency (p) will increase, as will the ’AA’ (P) genotype, while the ‘aa’ genotype (Q) and the frequency of ‘a’ (q) simultaneously decrease.
The ‘Aa’ (H) heterozygous genotype becomes more common as the ‘A’ allele increases in frequency, but as the ‘AA’ genotype becomes more and more common, ‘Aa’ drops off in frequency.
Eventually p may increase such that there are no more ‘a’ alleles left in the population. The ‘A’ allele by default has become fixed at locus A (it has reached fixation). As the only possible genotype is ‘AA’, P = 1 and H = Q = 0.
Please note that selecting for a particular allelic expression (ie selecting for ‘best’ phenotype) can change the gene frequency significantly in a population, but the genotypic frequencies change as a consequence of this. Selection does not directly change genotypic frequencies — they ‘follow along’ instead.
The next post will cover how mating systems can shift gene and genotypic frequencies in a population — but this time it’s the genotypic frequencies that are changed directly.

Leave a comment